by Mike Brown | Dec 28, 2018 | Agile, Atlassian, Jira
By now you have heard of our latest free app to reach the Atlassian Marketplace, “Color Queues for Jira Service Desk”: Color Queues for Jira Service Desk. If not, Color Queues is a free app developed by Ascend Integrated enabling users to highlight and focus on queues in their Service Desk project. Using Color Queues enables your agents / teams to organize their queues using color coding, ensuring a faster response and resolution time for your customer’s requests.
In this blog, we’re going to cover three major use cases for Color Queues and leveraging existing Jira Service Desk functionality so you can get the most out of our app. Note, you will need to be a Project Administrator to enable and configure Color Queues.
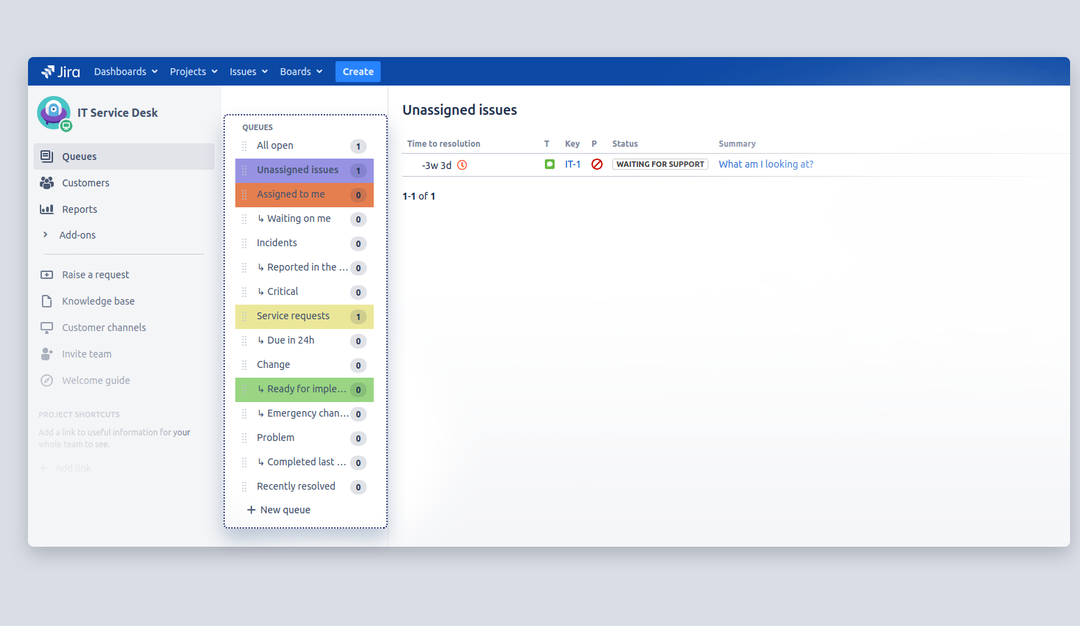
Identify Your Tasks
Do you have a specific queue you work within? Quickly and easily identify your queue from the list, especially if your team is working with A LOT of queues. Working with your Project Administrator, create a queue with issues assigned only to you (i.e. assignee = currentUser() and resolution is empty) and assign a color. Now, you (and all your fellow Service Desk Agents) will be able to focus on which queue identifies your current, open tasks / requests.
Figure 1: Creating the “My Open Requests” Queue
Figure 2: Viewing the “My Open Requests” Queue with “Color Queues” enabled
View Critical / High Priority Requests
When your customers enter high-priority requests or issues, you want to identify these right away in your large list of queues. To configure, create a new queue and set “Issues to Show” to only high priority issues where there is no set resolution (i.e. priority = “Critical” and resolution is EMPTY). Identify a color, click “Create”, and your queue will appear!
Figure 3: Creating the High Priority Requests Queue
Figure 4: Viewing the High Priority Request Queue in the Queue List
View Expiring SLAs For Powerful Reporting
Does your organization monitor SLAs closely? Use Color Queues in Coordination with your SLAs! Create a queue showing all open requests / issues that are expiring in 1 hour or less (i.e. use a JQL query like “Time to resolution” < remaining (“1h”).
After you create this queue, assign a color to it, and easily identify all requests whose SLA’s are expiring:
Figure 5: Creating a SLA Expiration Queue using Color Queues
And now your service desk team can easily identify those requests expiring in 1 hour or less!
Figure 6: Viewing the Expiring SLAs Queue
How are you using Color Queues? Let us know in the comments section or drop us a note: Contact Us!
by Mike Brown | Dec 11, 2018 | Jira
Sometimes, you need to get more out of what you’re viewing in your issue. Out of the box, Atlassian provides a powerhouse of options and field customizations available to the user. However, users of Jira often get hung up on the terminology and vocabulary introduced through a Jira issue (i.e. Summary = Title of an issue).
Enter Copy & Sync, a versatile and powerful app developed by Elements allowing administrators to add custom data panels (and more) to your issues. You can find the app and further details here: Copy & Sync.
Why Copy & Sync?
Copy & Sync enables you to display data the way you would like your users to read it in an issue view. Users will be able to view everything they need out of an issue screen, and will not need to cycle / navigate between multiple issues. Overall, this app increases the overall usability of your Jira instance, enabling users to have all the data points they need at their fingertips.
Custom Display & Data Panels
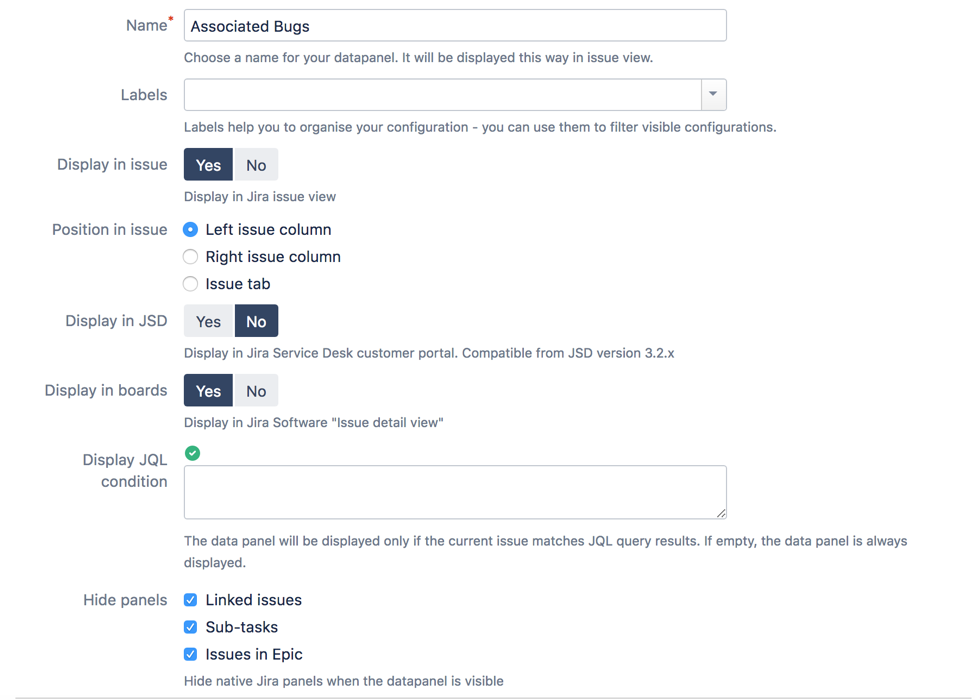
Copy & Sync allows users to display custom data panels directly in the Jira issue. A perfect example would be to display a data panel on a story issue type displaying bugs related to that user story. To create this panel, navigate to the Add-ons section, and find the Configuration link for Copy & Sync. You will need to be a Jira Administrator to configure this panel.
- Synchronisations – under the “Synchronisations” tab, select the information you’d like to synchronize with (it will be with your local Jira instance).
- Fields Mapping – map fields you would like to display in your panel.
Data Panel – select the following information:
- Display JQL Condition – determine which issues will display this panel
- Hide Panels – hide any standard issue panels (see my example input below)
- Issue to Display – displays issues which match a specific JQL and Link Type
- Linked Issues Filter – displays the specific issues in the panel, here I want to display all bugs (issuetype = Bug)
- Link Type – display the linked issue type you would like to have on the panel. Here I’m going to only show blocked issue links.
- Table – Display any custom headers (explained in more detail below)
- Actions – This section allows you to further refine the panel, data displayed, etc.
After you completed these configurations, click save and navigate back to your issue. You will see a new panel, with the custom Summary field pointing to ONLY bugs with the “Blocked” link type in your User Story. Note the “Issue Links” panel is now hidden:
Display Custom Headers
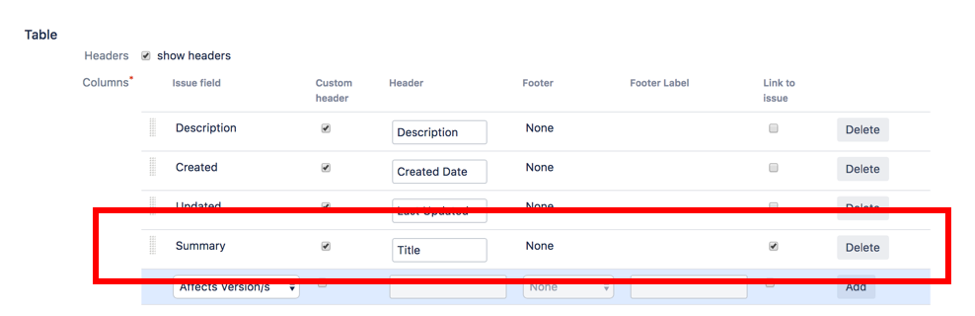
If you want to remove or re-name fields in your Data Panel, you can update this in the “Table” section of the Data Panel. Under Columns, select the field you would like displayed, check “Custom Header” and type a custom title / field name.
In this example, I have set the value of “Summary” to “Title” in the Header column. Note the order of the fields. With “Summary” (i.e. Title) being at the bottom, this will display first in the issue on the left-hand side.
Collaborate With ScriptRunner to Hide Noise in your Issue
Looking to hide some of those other Data Panels and just display the panels you created using Copy & Sync? Out of the box, Copy & Sync allows you to hide Linked issues, Sub-Tasks, and Issues in Epic. But, if you’re looking to hide other panels, this is the place!
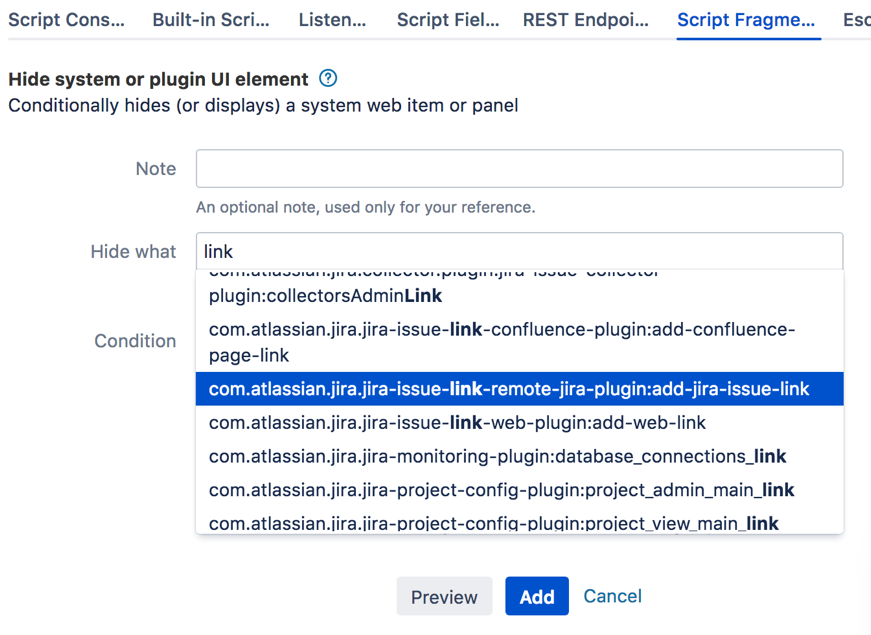
Utilize the ScriptRunner “Script Fragments” functionality to show or remove web panels from an Issue view. Under Script Fragments, select “Hide system or plugin UI element” and search for the panel / UI component you’re looking to hide in your issue.
Copy & Sync provides even more customization / capabilities than mentioned in this blog. We encourage you to check it out, and find some excellent workarounds and new methods to display your data consistently across Jira issues.
Are you using Copy & Sync? Interested in learning more? Contact us!